
Результаты поиска
Создать страницу «More Difference» в этом вики-проекте! См. также найденные результаты поиска.
 Commons Public Domain Mark 1.0falsefalse en:Image:WTC-Fireman requests 10 more colleages.jpg English applies to jurisdiction: United States of America determination...(2760 × 1960 (3,07 МБ)) - 15:18, 4 ноября 2024
 of arteries, veins, and capillaries. Also shows cross-sectional area differences. Spanish Diagrama de arterias, venas y capilares. También muestra las...(720 × 496 (513 КБ)) - 09:02, 11 ноября 2024
 Evidence: Glowing spot in background could be lights at Bear Lake FamCamp, 64°42′6.73″N 147°6′51.84″W / 64.7018694°N 147.1144°W / 64.7018694; -147.1144...(3008 × 1960 (4,42 МБ)) - 23:54, 4 октября 2024
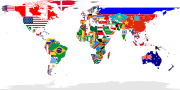 1914 405 57 42 2400 1200 The Republic of China (Taiwan) is disputed territory, after losing its status as a full member of the United Nations. It is shown...(2400 × 1200 (7,34 МБ)) - 12:04, 13 октября 2024
 English determination method or standard: SHA-1...(512 × 614 (596 КБ)) - 01:51, 29 октября 2024
 English object of statement has role: photographer URL: https://commons.wikimedia.org/wiki/User:Wilder_Kaiser Wikimedia username: Wilder Kaiser author...(2538 × 1699 (1,15 МБ)) - 11:49, 11 июля 2024
 Файл:Nowruz 2017 in Bisaran, Kurdistan province.jpg (перенаправление с The Differences.jpg)infringement claims. Though not obliged to do so, the uploader may be able to help you to obtain such evidence. See our general disclaimer for more information....(3100 × 2067 (5,66 МБ)) - 02:12, 13 августа 2024
 I, the copyright holder of this work, hereby publish it under the following license: This file is licensed under the Creative Commons Attribution-Share...(5114 × 3073 (9,43 МБ)) - 17:13, 15 ноября 2024
 I, the copyright holder of this work, hereby publish it under the following license: English Ship graveyard at Rimel Beach, south of Bizerte, Tunisia....(5872 × 3915 (11,74 МБ)) - 16:41, 4 ноября 2024
 I, the copyright holder of this work, hereby publish it under the following license: This file is licensed under the Creative Commons Attribution-Share...(6000 × 5000 (15,47 МБ)) - 23:37, 13 августа 2024
 hexagon is visible around Saturn's north pole. When Cassini arrived in 2004, more of the northern hemisphere sported a bluish hue and it was northern winter...(3600 × 2700 (2,75 МБ)) - 11:53, 6 сентября 2024
 I, the copyright holder of this work, hereby publish it under the following license: This file is licensed under the Creative Commons Attribution-Share...(5568 × 3712 (19,33 МБ)) - 22:18, 3 октября 2024
 English Chinese (Taiwan) 契卡洛夫地鐵站,位於俄羅斯葉卡捷琳堡(凱薩琳堡) Russian Посадочная платформа станции "Чкаловская" Екатеринбургского метрополитена URL: https://commons...(7571 × 4259 (12,51 МБ)) - 11:16, 13 июля 2024
 inception: 2 August 2024 determination method or standard: Imagehash difference hash inception: 2 August 2024 described at URL: https://www.finna.fi/Record/museovirasto...(4500 × 5664 (24,27 МБ)) - 15:53, 27 октября 2024
 Elizabeta Dancia Thomae Mori filia anno 21 Elizabeth Dauncey, daughter of Thomas More, age 21 (1506-1564) 525 572 219 376 2659 1878 Margaretha Giga Clemens uxor...(2659 × 1878 (2,36 МБ)) - 07:57, 13 сентября 2024
 I, the copyright holder of this work, hereby publish it under the following license: This file is licensed under the Creative Commons Attribution-Share...(6405 × 4320 (2,49 МБ)) - 16:44, 24 октября 2024
 of the more obvious letter differences. {{GFDL-self}} 2006-11-22 09:30 Stottpie 294×228×8 (9028 bytes) Direct comparison between some of the more obvious...(864 × 576 (28 КБ)) - 20:22, 17 марта 2023
 area as a difference of integrals created by user:gunther using xfig and vi English...(2381 × 594 (23 КБ)) - 13:40, 11 октября 2020
 was a Tank Commander on an Early M60 and know the difference. There are other more subtle differences. applies to jurisdiction: United States of America...(2830 × 1890 (1,76 МБ)) - 08:25, 19 августа 2024
 Composite This side-by-side comparison shows the subtle, though significant, differences in the X-ray (green) and optical (blue) emission from the planet Venus...(3000 × 1465 (1,39 МБ)) - 02:03, 17 ноября 2024
.jpg)


.svg)
.svg)


.jpg)


