
Файл:Carbon cycle-cute diagram ta.svg

Размер этого PNG-превью для исходного SVG-файла: 540 × 417 пкс. Другие разрешения: 311 × 240 пкс | 622 × 480 пкс | 995 × 768 пкс | 1280 × 988 пкс | 2560 × 1977 пкс.
Исходный файл (SVG-файл, номинально 540 × 417 пкс, размер файла: 152 КБ)
Краткое описание
| Описание |
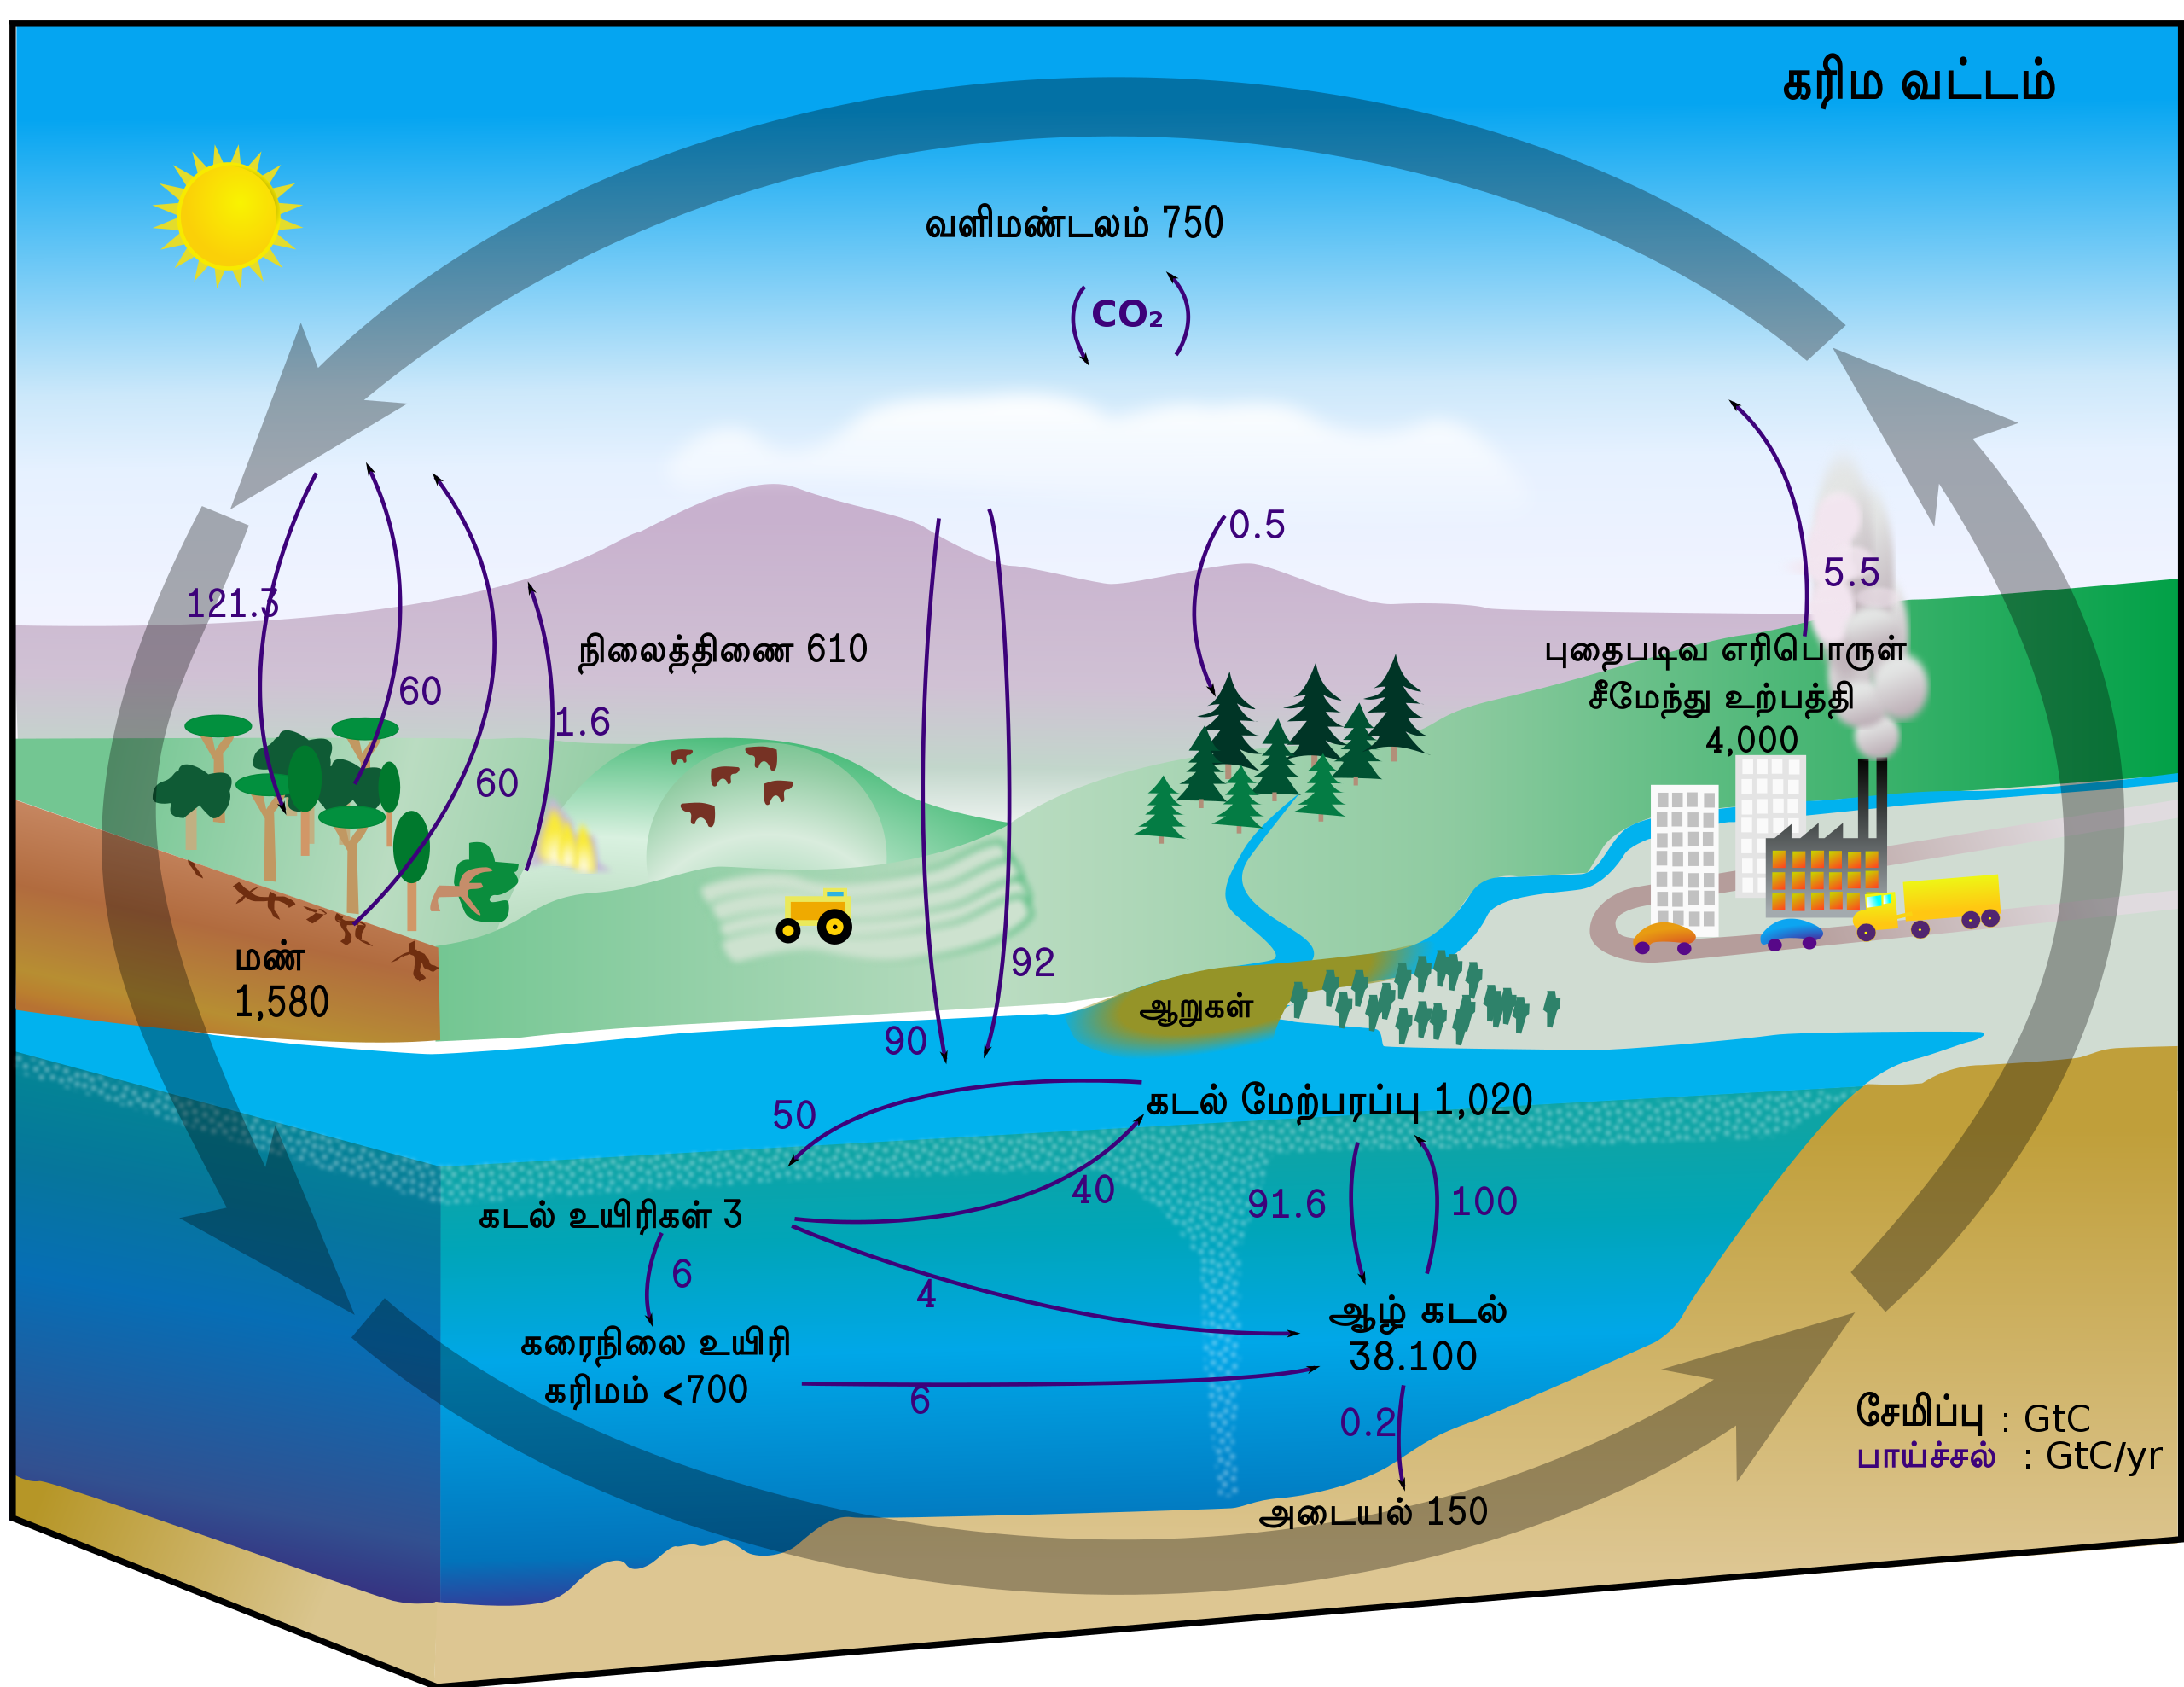
English: This carbon cycle diagram shows the storage and annual exchange of carbon between the atmosphere, hydrosphere and geosphere in gigatons - or billions of tons - of Carbon (GtC). Burning fossil fuels by people adds about 5.5 GtC of carbon per year into the atmosphere. Deutsch: Diagramm des Kohlenstoffkreislaufes. Die schwarzen Zahlen zeigen wie viele Milliarden Tonnen Kohlenstoff (Gt C) in den verschiedenen Resevoiren vorhanden sind. Die blauen Zahlen zeigen an, wie viel Kohlenstoff zwischen den einzelnen Speichern pro Jahr ausgetauscht wird. Español: Este esquema del ciclo del carbono muestra el almacenamiento y los cambios anuales del carbono entre la atmósfera, la hidrósfera y la geósfera en gigatones, o billones de toneladas, de carbono (GtC). La quema de conustibles fósiles libera cerca de 5.5 billones de toneladas de carbono al año en la atmósfera. 日本語: 炭素循環の概念図。黒の数値はそれぞれのリザーバーに存在する炭素量、青の数値はリザーバー間での年間の炭素の移動量。単位はギガt(10億トン) Русский: Схема геохимического цикла углерода показывает количество углерода в атмосфере, гидросфере, и геосфере Земли, а также годовой перенос углерода между ними. Все величины в гигатоннах (миллиардах тонн). В результате сжигания ископаемого топлива, человечество ежегодно добавляет 5,5 гигатонн углерода в атмосферу. English: Humanity adds about 5.5 billion tons of carbon dioxide per year, most of which goes directly into the atmosphere. From http://earthobservatory.nasa.gov/Library/CarbonCycle/carbon_cycle4.html |
| Дата | 7 августа 2008, 13:14 (UTC) |
| Источник | |
| Автор |
|
| Это отретушированное изображение, что означает, что первоначальной версия изображения была изменена цифровым способом. Изменения: Added Tamil text. Оригинал доступен по ссылке: Carbon cycle-cute diagram.svg:
|
| Я, владелец авторских прав на это произведение, передаю его в общественное достояние. Это разрешение действует по всему миру. В некоторых странах это не может быть возможно юридически, в таком случае: Я даю право кому угодно использовать данное произведение в любых целях без каких-либо условий, за исключением таких условий, которые требуются по закону. |
Исходный журнал загрузок
This image is a derivative work of the following images:
- Image:Carbon_cycle-cute_diagram.svg licensed with PD-self
- 2008-06-01T02:20:22Z FischX 540x417 (154403 Bytes) {{Information |Description= |Source= |Date= |Author= |Permission= |other_versions= }}
- 2008-05-30T02:17:27Z FischX 540x417 (125503 Bytes) {{Information |Description= |Source= |Date= |Author= |Permission= |other_versions= }}
- 2008-05-30T02:03:21Z FischX 540x417 (126458 Bytes) {{Information |Description={{en|This [[:en:carbon cycle|carbon cycle]] diagram shows the storage and annual exchange of carbon between the [[:en:Earth's atmosphere|atmosphere]], [[:en:hydrosphere|hydrosphere]] and [[:en:geosp
- Image:Carbon_cycle-cute_diagram-german.svg licensed with PD-self
- 2008-06-12T01:24:47Z FischX 540x417 (165287 Bytes) Reverted to version as of 01:17, 12 June 2008
- 2008-06-12T01:24:12Z FischX 540x417 (154220 Bytes) Reverted to version as of 21:53, 2 June 2008
- 2008-06-12T01:17:57Z FischX 540x417 (165287 Bytes) {{Information |Description= |Source= |Date= |Author= |Permission= |other_versions= }}
- 2008-06-02T21:53:21Z FischX 540x417 (154220 Bytes) {{Information |Description= |Source= |Date= |Author= |Permission= |other_versions= }}
- 2008-06-02T21:46:22Z FischX 540x417 (154211 Bytes) {{Information |Description={{en|This [[:en:carbon cycle|carbon cycle]] diagram shows the storage and annual exchange of carbon between the [[:en:Earth's atmosphere|atmosphere]], [[:en:hydrosphere|hydrosphere]] and [[:en:geosp
- Image:Carbon_cycle-cute_diagram.jpeg licensed with PD-USGov-NASA, PD-USGov-NASA/copyright
- 2006-09-12T15:16:24Z Giac83 540x417 (53453 Bytes) {{Information| |Description= This [[:en:carbon cycle]] diagram shows the storage and yearly changes of the carbon between the [[:en:Earth's atmosphere|atmosphere]], [[:en:hydrosphere]] and [[:en:geosphere]] in Gigatons - or b
- Image:Carbon_cycle-cute_diagram_Dutch_text.jpg licensed with PD-USGov-NASA, PD-USGov-NASA/copyright, PD-user
- 2006-11-08T14:02:32Z Rasbak 848x659 (99912 Bytes) Picture from commons now with Dutch text. {{GFDL}} Information on commons: == Dettagli == {{Information| |Description= This [[:en:carbon cycle]] diagram shows the storage and yearly changes of the carbon between the [[:en:Ea
Uploaded with derivativeFX
История файла
Нажмите на дату/время, чтобы увидеть версию файла от того времени.
| Дата/время | Миниатюра | Размеры | Участник | Примечание | |
|---|---|---|---|---|---|
| текущий | 16:33, 7 августа 2008 | | 540 × 417 (152 КБ) | Trengarasu | |
| 16:30, 7 августа 2008 |  | 540 × 417 (152 КБ) | Trengarasu | ||
| 16:29, 7 августа 2008 |  | 540 × 417 (152 КБ) | Trengarasu | ||
| 16:25, 7 августа 2008 |  | 540 × 417 (152 КБ) | Trengarasu | ||
| 16:18, 7 августа 2008 |  | 540 × 417 (151 КБ) | Trengarasu | {{Information |Description={{en|This carbon cycle diagram shows the storage and annual exchange of carbon between the atmosphere, hydrosphere and geosphere in gigatons - |
Использование файла
Нет страниц, использующих этот файл.