
Файл:Periodic points of f(z) = z*z-0.75 for period =6 as intersections of 2 implicit curves.svg

Размер этого PNG-превью для исходного SVG-файла: 600 × 600 пкс. Другие разрешения: 240 × 240 пкс | 480 × 480 пкс | 768 × 768 пкс | 1024 × 1024 пкс | 2048 × 2048 пкс | 1000 × 1000 пкс.
Исходный файл (SVG-файл, номинально 1000 × 1000 пкс, размер файла: 2,28 МБ)
Краткое описание
| Описание |
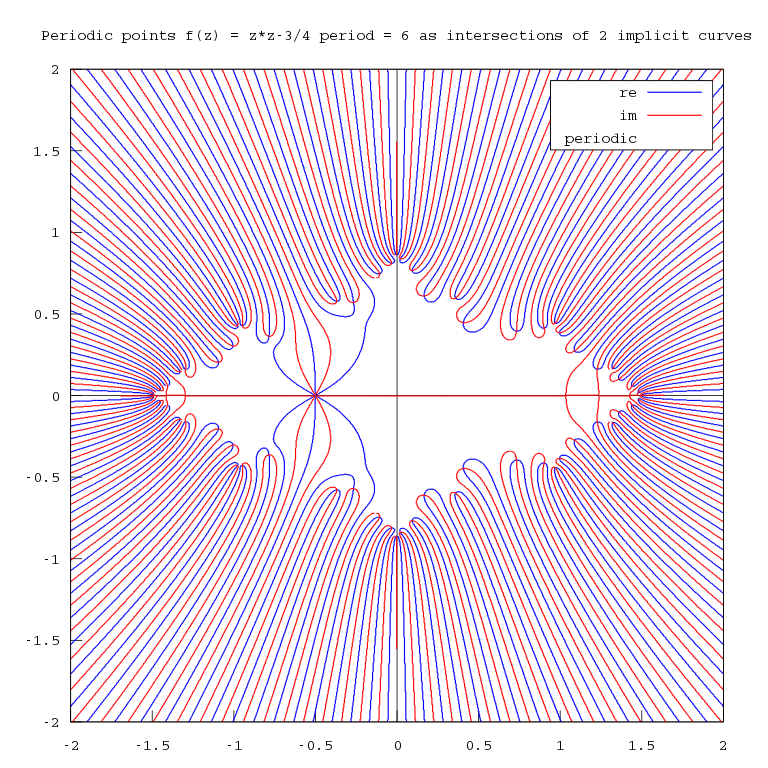
English: Periodic points of f(z) = z*z-0.75 for period =6 as intersections of 2 implicit curves "(which are related by the Cauchy-Riemann equations) separately. Their intersections give the complex roots of the original function. "[1] |
| Дата | |
| Источник | Собственная работа |
| Автор | Adam majewski |
| Другие версии |
|
| SVG‑разработка |
_%3D_z*z-0.75_for_period_%3D4_as_intersections_of_2_implicit_curves.svg)
_%3D_z*z-0.75_for_period_%3D3_as_intersections_of_2_implicit_curves.png)

_%3D_z*z-0.75_for_period_%3D6_as_intersections_of_2_implicit_curves.svg)
Лицензирование
Я, владелец авторских прав на это произведение, добровольно публикую его на условиях следующей лицензии:
Этот файл доступен по лицензии Creative Commons Attribution-Share Alike 4.0 International
- Вы можете свободно:
- делиться произведением – копировать, распространять и передавать данное произведение
- создавать производные – переделывать данное произведение
- При соблюдении следующих условий:
- атрибуция – Вы должны указать авторство, предоставить ссылку на лицензию и указать, внёс ли автор какие-либо изменения. Это можно сделать любым разумным способом, но не создавая впечатление, что лицензиат поддерживает вас или использование вами данного произведения.
- распространение на тех же условиях – Если вы изменяете, преобразуете или создаёте иное произведение на основе данного, то обязаны использовать лицензию исходного произведения или лицензию, совместимую с исходной.
Maxima CAS src code
/*

find periodic points of f^n(z,c)
zn = z0


A useful way to visualize the roots of a complex function is to plot the 0 contours of the real and imaginary parts. That is, compute z = Dm(...) on a reasonably dense grid, and then use matplotlib's contour function to plot the contours where z.real is 0 and where z.imag is zero. The roots of the function are the points where these contours intersect.
Warren Weckesser

https://stackoverflow.com/questions/24419164/storing-roots-of-a-complex-function-in-an-array-in-scipy/24421779#24421779


*/

kill(all);
remvalue(all);
ratprint:false;
numer:true$
display2d:false$


declare (z, complex)$
declare ([x,y], real)$
z:x+y*%i;


/* -------------------functions --------------------------------------*/
f(z):= z*z+c$ /* complex quadratic polynomial */

/* iterated function */
fn(n, z) :=
  if n=0
  	then z
  	else 	(if n=1
  			then f(z)
  			else f(fn(n-1, z))
  		)$

/* for periodic points {z: zp=z0 }*/
Fn(n,z) := fn(n, z) - z$

/*
converts complex number z = x*y*%i
to the list in a draw format:
[x,y]
*/
dr(z):=[float(realpart(z)), float(imagpart(z))]$

ToPoints(myList):= points(map(dr,myList))$

compile(all)$


/* constants */
period :4$

c:-3/4$


/* ------------------ computations ---------------------------------------*/
zp:  Fn(period, z)$
e1: realpart(zp )=0$
e2: imagpart(zp )=0$

/*
find periodic points using numerical method
*/
polyfactor:false$
if ( period < 6) /* allroots fails for period >5 */
	then sol: allroots(%i*Fn(period, w))
	else ( /* increase precision of numerical computations */
		print("bfloat"),
		fpprec : 32, /*Default value: 16, it is the number of significant digits for arithmetic on bigfloat numbers */
		float2bf : true,
		sol: bfallroots(%i*Fn(period, bfloat(w) ))

		)$

sol: map(rhs,sol)$
intersections:ToPoints(sol)$


dSize : 2$ /* image size in world coordinate =  x, -dSize,dSize, y, -dSize,dSize), */
path:"~/Dokumenty/newton/2/"$ /*  pwd, if empty then file is in a home dir , path should end with "/" */

/* draw it using draw package ( Maxima-Gnuplot interface) by Mario Rodríguez Riotorto */
draw2d(
	file_name = sconcat(path, string(period)),
	terminal   = svg,
	dimensions = [1000,1000],
	/* the text */
  	color     = black,
  	font      = "Courier",
  	font_size = 20,
	title = sconcat("Periodic points f(z) = z*z-3/4 period = ", string(period), " as intersections of 2 implicit curves"),
	user_preamble = "set key box opaque ", /* legend ovelaps the graph */
  	/* */
  	grid       = false,
  	xaxis = false,
  	yaxis = false,
  	xaxis_type  = solid,
  	yaxis_type  = solid,
  	xaxis_color = black,
  	yaxis_color = black,
  	proportional_axes = xy,

  	/* implicit curves */
  	ip_grid = [200, 200], /* precision and time of computations for implicit curves */
  	line_width = 1.5,
  	line_type = solid,
  	/* first curve */
  	key        = "re",
  	color = blue,
  	implicit(e1, x, -dSize,dSize, y, -dSize,dSize),
  	/* second curve */
  	color      = red,
  	key        = "im",
  	implicit(e2, x, -dSize,dSize, y, -dSize,dSize),
  	/* points */
  	point_type= filled_circle,
  	point_size = 0.5,
  	color= black,
  	key = "periodic",
  	intersections

   ) $
- ↑ Weisstein, Eric W. "Root." From MathWorld--A Wolfram Web Resource. https://mathworld.wolfram.com/Root.html
История файла
Нажмите на дату/время, чтобы увидеть версию файла от того времени.
| Дата/время | Миниатюра | Размеры | Участник | Примечание | |
|---|---|---|---|---|---|
| текущий | 13:31, 27 декабря 2020 | | 1000 × 1000 (2,28 МБ) | Soul windsurfer | Uploaded own work with UploadWizard |
Использование файла
Нет страниц, использующих этот файл.
Глобальное использование файла
Данный файл используется в следующих вики:
- Использование в el.wikipedia.org
- Использование в en.wikipedia.org
- Использование в en.wikibooks.org
_%3D_z*z-0.75_for_period_%3D6_as_intersections_of_2_implicit_curves.svg)